Chart Canvas
by gluipcommunityv0.3.2
1
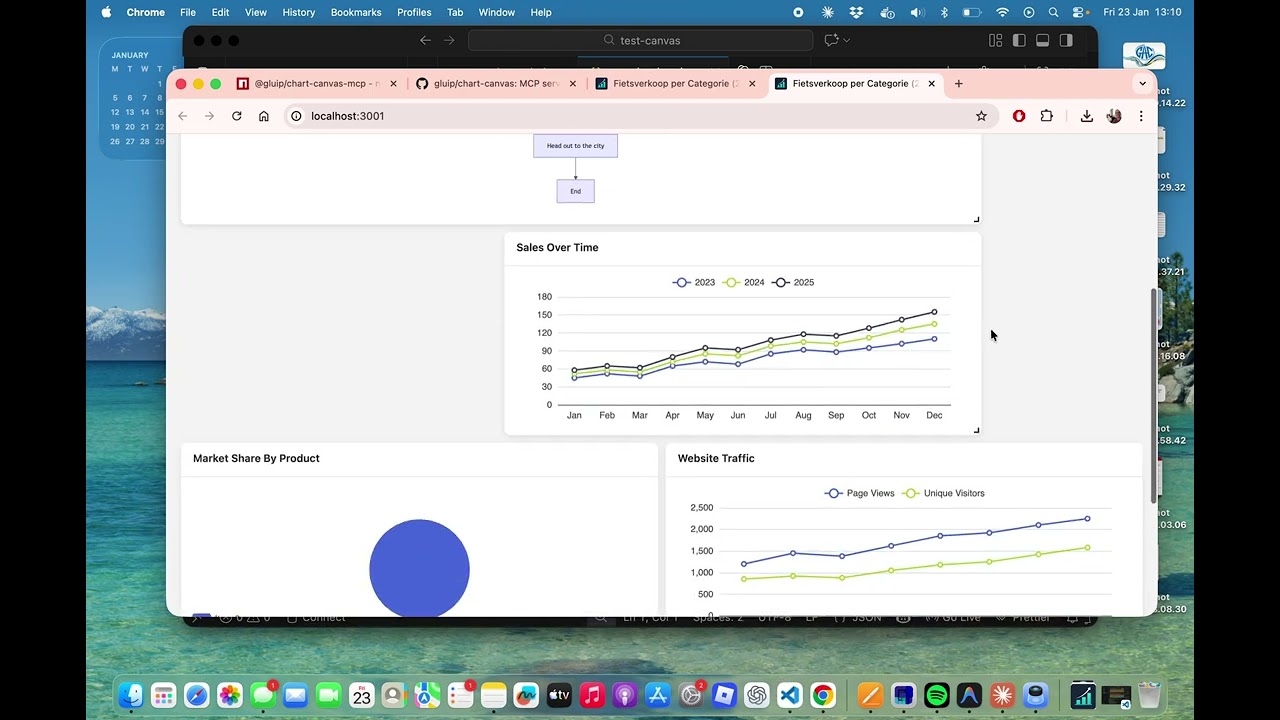
Chart Canvas MCP Server provides an interactive visualization dashboard for creating charts, diagrams, and tables from AI conversations using the Model Context Protocol.
From the registry: Create interactive visualizations and query data sources (SQLite, CSV, Parquet, JSON)
Install & configure
Install in your client
Paste into the AI you're chatting with — it will figure out the rest
Please install the `chart-canvas` MCP server into my current AI client (that's you).

Canonical MCP server config (stdio transport):
- command: `npx`
- args: ["-y","@gluip/chart-canvas-mcp"]

Note: Interactive visualization dashboard. Server starts on port 3000. Supports SQLite, CSV, Parquet, JSON via DuckDB. ECharts and Mermaid diagrams.

Add this MCP server to my current client's config in the correct format for you. If you need secrets or credentials I haven't provided, ASK me — do not invent values or leave raw placeholders. After adding it, tell me how to verify the server is connected.
Note: Interactive visualization dashboard. Server starts on port 3000. Supports SQLite, CSV, Parquet, JSON via DuckDB. ECharts and Mermaid diagrams.
Tools (6)
addVisualization
Create charts, diagrams, and tables on the canvas.
removeVisualization
Remove a specific visualization by ID.
clearCanvas
Remove all visualizations from the canvas.
showCanvas
Open the dashboard in your default browser.
getDatabaseSchema
Inspect the structure of a SQLite database.
queryAndVisualize
Execute a SQL query on a SQLite database and create a visualization from the results.
Packages
@gluip/chart-canvas-mcp
npmv0.3.2transport: stdio
Details
- Language
- TypeScript
- License
- MIT
- Released
- Jan 25, 2026
- Last commit
- May 9, 2026
- Registry name
- io.github.gluip/chart-canvas
Categories
Related Servers
Labelhead Artist Momentum
Trending hip-hop artist momentum scores across four cultural dimensions.
74.6k
PostHog MCP Server
Official PostHog MCP Server for product analytics, feature flags, experiments, and more.
37.3k
Openmetadata Mcp
Official OpenMetadata MCP: governed context and business semantics for AI assistants and agents.
14.5k